
I heard a story about a manager walking into a sprint planning meeting years ago to find their lead developer breaking down a simple authentication fix into seven separate stories. “We need to hit our velocity target,” he explained. That moment crystallized a pattern I’d been seeing for years, smart engineers wasting energy gaming metrics instead of shipping features. When you measure the wrong things, you get the wrong behaviors.
The Gaming Problem
Throughout my career in engineering, I’ve watched teams destroy their productivity chasing meaningless numbers. Two patterns dominate:
The Story Point Inflation Game
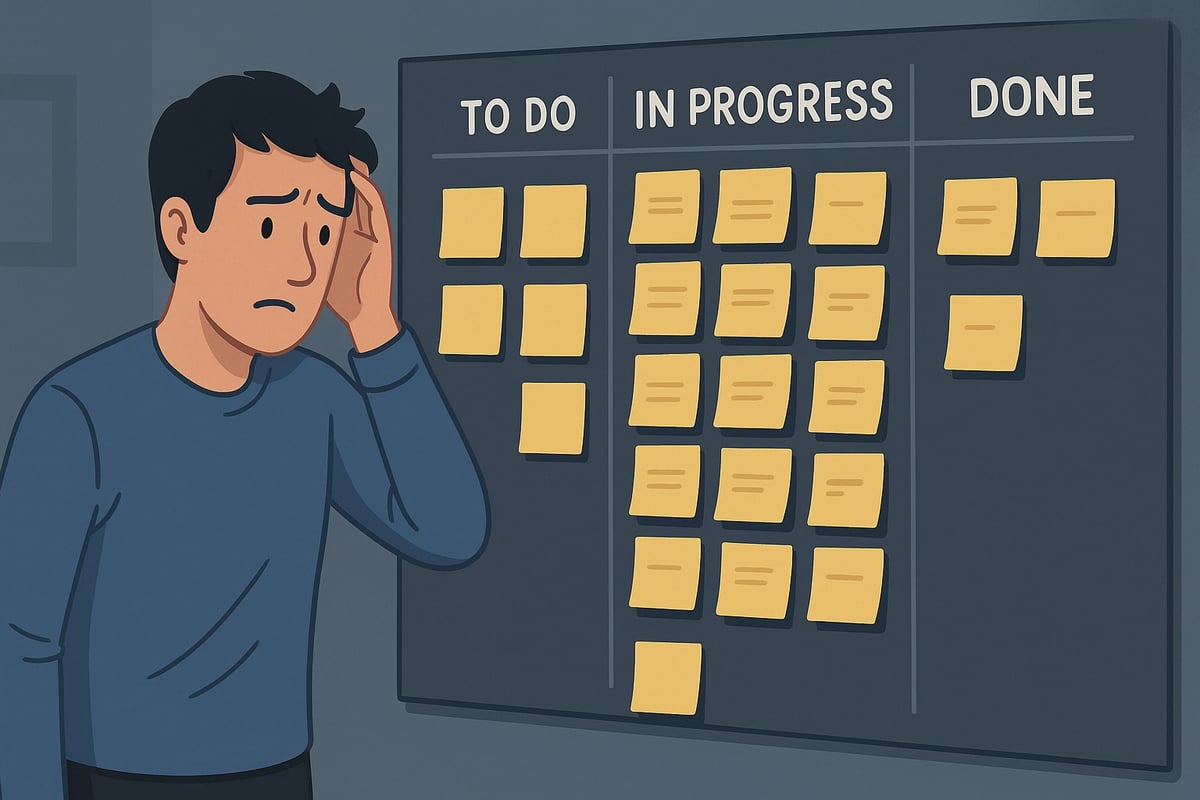
I’ve lived through this repeatedly: Quarter one delivers 80 points. Management celebrates and demands 100 next quarter. Suddenly, two-point fixes become eight-pointers. One startup discovered their story points had inflated by 60% over six months while actual feature delivery dropped by half. The engineers weren’t lazy… They were responding rationally to irrational incentives.
The Velocity Vanity Metric
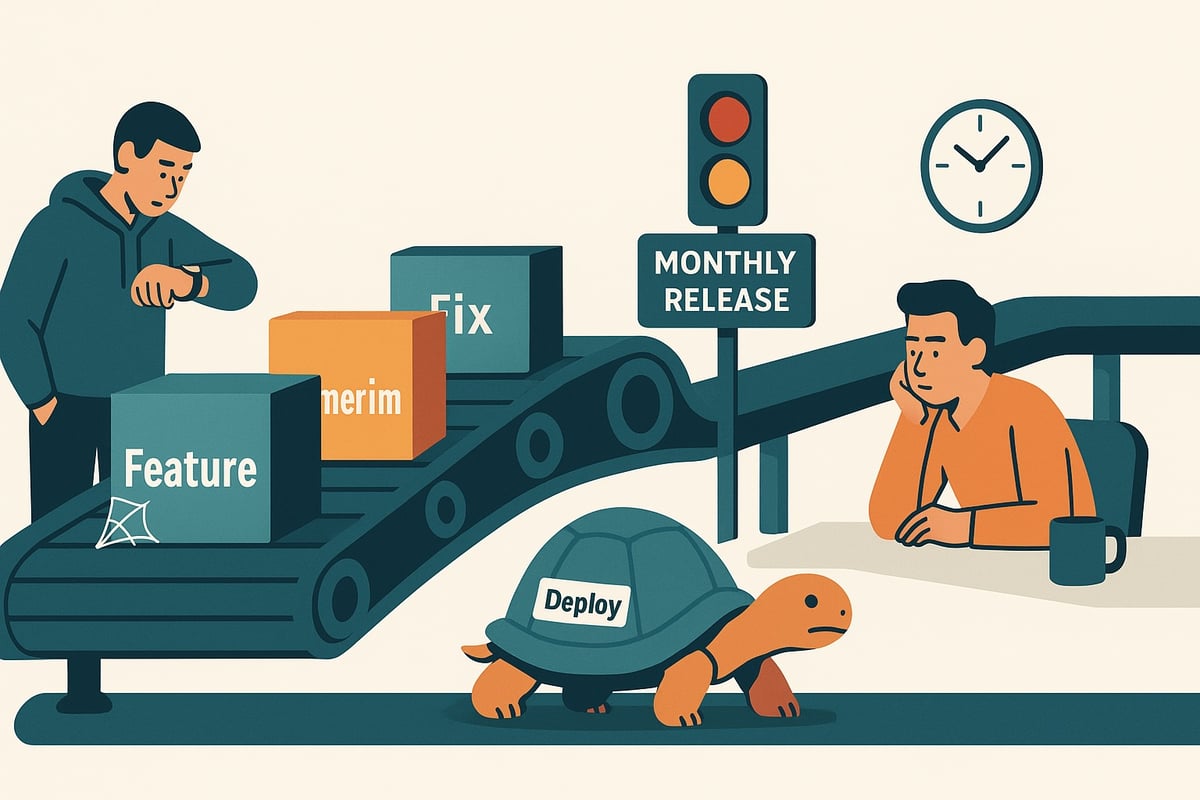
Every high-performing team eventually learns that velocity without context is meaningless. I learned this when my team “delivered” 40 points in a sprint while our major feature was months delayed. We’d optimized for the metric, not the outcome. Your CEO doesn’t care about velocity. Your customers don’t care about commit counts. They care about when features ship and whether they work.
Why Output Metrics Transform Teams
The real problem? We measure proxies instead of outcomes. After living through many failed “transformations,” I’ve learned: you get what you measure, so measure what you actually want.
The shift from input to output metrics completely transforms how teams operate. Here’s what works:
Track the entire value stream. Last month, a team discovered their “two-week sprints” actually took eight weeks from concept to customer. Once visible, they cut cycle time by 75% in three months. The difference between elite and struggling teams? Elite teams measure the whole journey, not just coding.
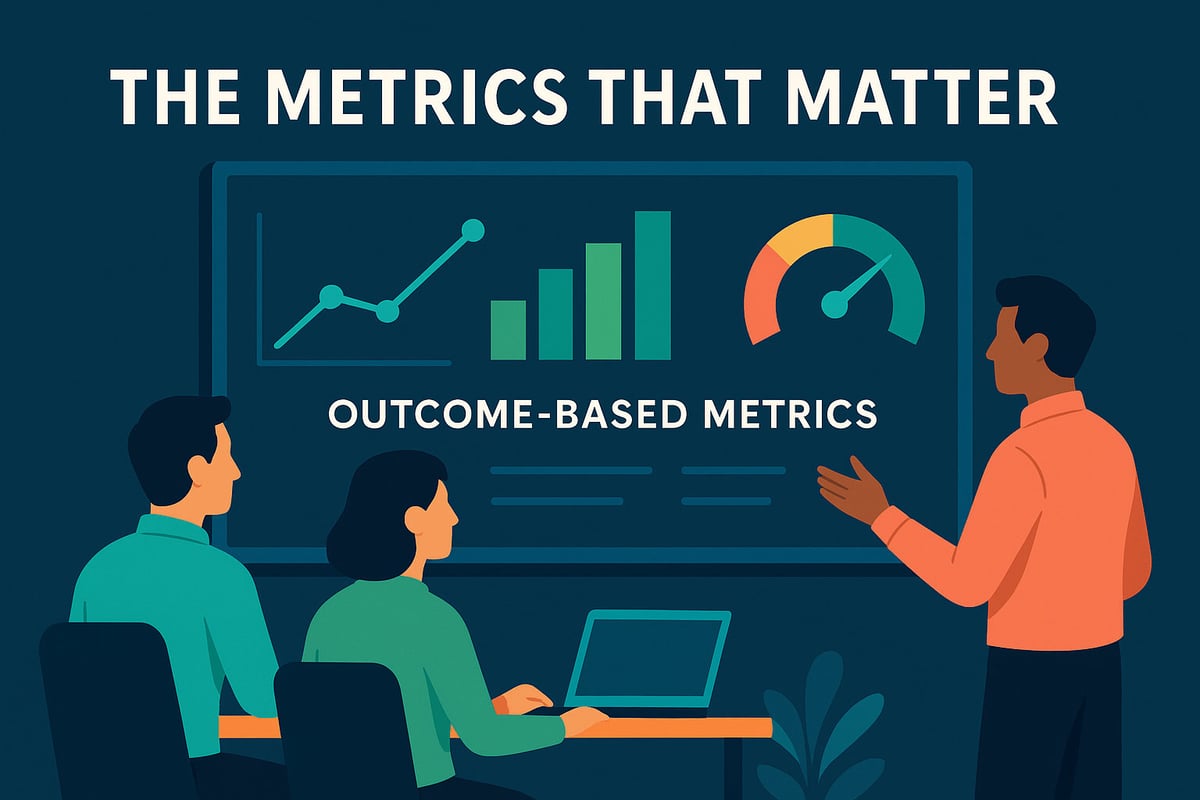
Focus on business outcomes. The metrics that matter:
- Feature lead time (idea to customer)
- Deployment frequency (how often you deliver value)
- Mean time to recovery (how quickly you fix problems)
- Feature adoption rate (whether customers use what you build)
Notice what’s missing? Story points. Lines of code. Those are noise.
Create feedback loops. A team can cut their 45-day lead time to 12 days by dissecting where time was lost. That’s potentially $50,000 per week of additional value delivered.
Your Action Plan
Having seen this transition many times, here’s what works:
Week 1: Face Reality
- Map your actual feature flow (it’s longer than you think)
- Track ONE feature through every handoff
- Calculate cost of delay
- Stop talking about story points in meetings
Week 2: Start Measuring What Matters
- Track feature cycle time for all new work
- Make it visible to everyone
- Ask daily: “What’s blocking this from reaching customers?”
Week 3: Kill Your Worst Metric
- Stop reporting velocity upward
- Replace with deployment frequency
- Watch team behavior change immediately
Week 4: Embed the Change
- Add customer-facing metrics
- Plan based on lead time, not points
- Celebrate customer value, not activity
The Bottom Line
Your best engineers already know current metrics are broken. They’re either gaming the system or updating LinkedIn. Tomorrow morning, look at your dashboard. For every metric, ask: “If this doubles, will customers be happier?” If not, you’re measuring the wrong thing.
Start with one change: Track feature cycle time for 30 days. Make it visible. Talk about it daily.
The teams that make this shift don’t just perform better, they transform entirely. Ready to stop playing metric games and start delivering value?
I help engineering leaders transform from metric-gaming to value-shipping. Let’s talk.